XAUUSD TAKE RESISTANCE FROM TRADE LINEHere I Created This XAUUSD Chart Analysis
Pair : XAUUSD (Gold)
Timeframe: 1- Hour
Pattern: Resistance Level
Momentum: Bearish/ SELL
Entry Level : SELL 3327
Resistance zone : 3335
Target Will Be : 3300 / 3272
Disclaimer : This signal is based on personal analysis for learning purposes. Trade at your own risk and always use proper risk management.
Chart Patterns
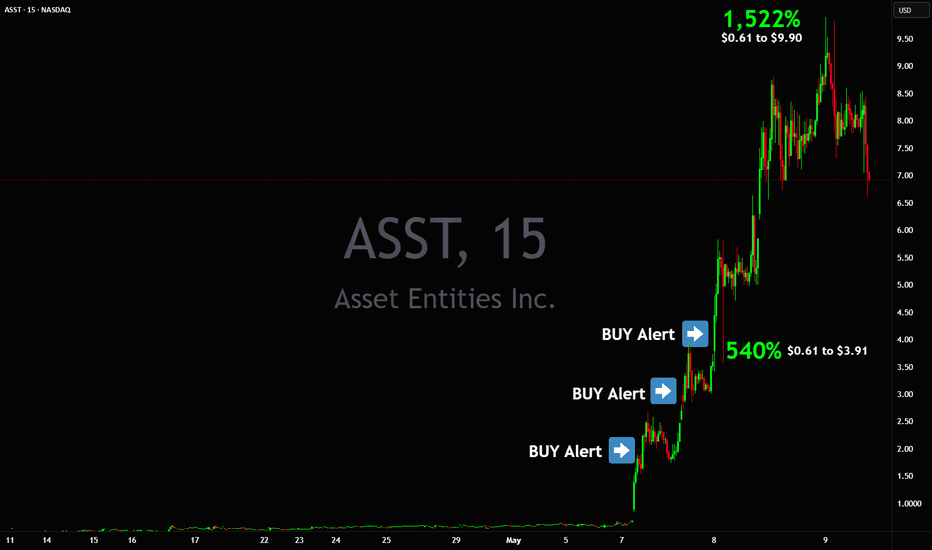
HUGE +1,522% in 2 days from $0.61 to $9.90 $ASSTIt was clear from the very start this one will go insane because of the volume. It traded 315 million shares on first day when I posted about it. I sent out a message premarket at the very beginning of the move and it already had tens of millions of shares volume at that time.
Then the next day it got to 241 million shares, you just don't see stuff like that in regular stocks.
Awesome profits made along the way, can't wait for a new catch like that!
NASDAQ:ASST
After a 37% Surge, Is Ethereum Still a Buy...?Ethereum Breaks Key Resistance, Signaling Potential Trend Reversal
Ethereum has delivered two significant technical signals indicating a potential trend reversal. The first is a breakout above the longstanding downtrend line, and the second is the breach of the critical \$2,100 resistance level. These developments suggest growing bullish momentum in the market.
With both confirmation signals in place, Ethereum appears poised for further upside. Traders may now look for a potential pullback or retest around the \$2,100 level, which could serve as a strategic entry point for long positions.
If this level holds as new support, the next target to watch is the \$2,800 mark, aligning with broader market expectations and previous price structure zones.
As always, traders should monitor price action closely and manage risk accordingly in case of volatility around key levels.
X2: NQ/US100/NAS100 Long - Day Trades 1:2X2:
Risking 1% to make 2%
NAS100, US100, NQ, NASDAQ Long for day trade, with my back testing of this strategy, it hits multiple possible take profits, manage your position accordingly.
Risking 1% to make 2%
Use proper risk management
Looks like good trade.
Lets monitor.
Use proper risk management.
Disclaimer: only idea, not advice
GBPUSD Technical Analysis! SELL!
My dear followers,
This is my opinion on the GBPUSD next move:
The asset is approaching an important pivot point 1.3290
Bias - Bearish
Technical Indicators: Supper Trend generates a clear short signal while Pivot Point HL is currently determining the overall Bearish trend of the market.
Goal - 1.3252
About Used Indicators:
For more efficient signals, super-trend is used in combination with other indicators like Pivot Points.
Disclosure: I am part of Trade Nation's Influencer program and receive a monthly fee for using their TradingView charts in my analysis.
———————————
WISH YOU ALL LUCK
XAU/USD: Gold Regains Strength After Pullback – New Highs Ahead?By analyzing the gold chart on the 2-hour timeframe, we can see that yesterday, as expected, gold surged above $3400, reaching as high as $3439 before facing strong selling pressure, dropping sharply to $3359.
Currently, gold is trading around $3385, and if the price can hold above $3366, we may expect further bullish momentum. I believe gold is setting up for another move above $3400, potentially aiming to break into new highs once again.
THE LATEST ANALYSIS :
Please support me with your likes and comments to motivate me to share more analysis with you and share your opinion about the possible trend of this chart with me !
Best Regards , Arman Shaban
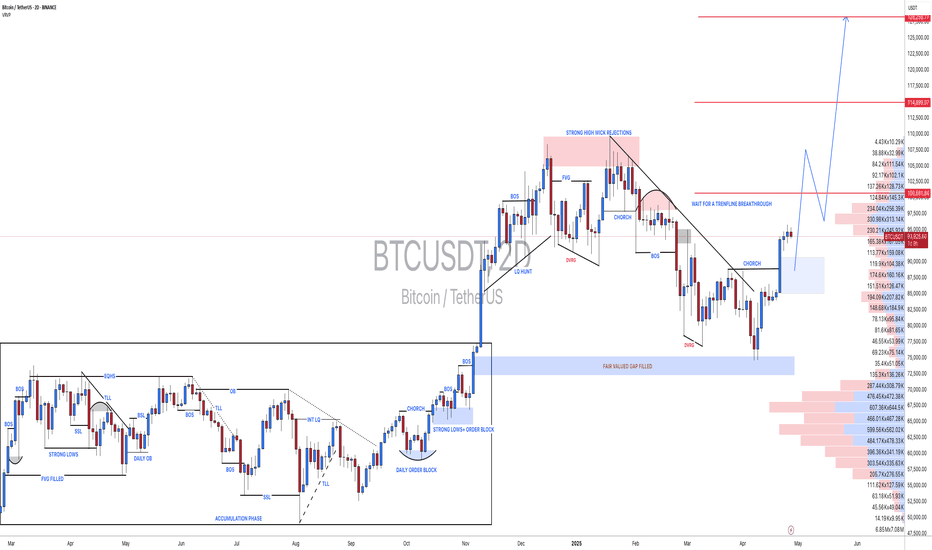
#BTCUSDT:Price Moving Well From $88,000 to $96,000,Next $128,000Bitcoin has moved well from our last idea of $88,000 to $96,000. However, a small correction is expected, which could be a good point to enter a swing trade. This could take the price to a new record high of around $128,000.
We have three targets, but each can be set based on your overview. The last three candles are not clear, so it’s best to wait for price to have a clearer indication of its next move.
We wish you the best and good luck in your trading journey. Thank you for your unwavering support! 😊
If you’d like to contribute, here are a few ways you can help us:
- Like our ideas
- Comment on our ideas
- Share our ideas
Team Setupsfx_
❤️🚀
#BTCUSDT: Will Bitcoin Make Any Correction To $90,000?Hey Everyone,
Happy Sunday
Currently, Bitcoin’s price is consolidating within a shorter timeframe, which has heightened the likelihood of it reaching the $90,000 ‘FVG’ region. However, this could be attributed to the hectic week we experienced, with numerous significant market announcements that have heightened uncertainty in the cryptocurrency market. At present, there are two opportunities for Bitcoin: one is riskier, while the other is considerably safer. You can utilise this analysis as a secondary bias.
We extend our best wishes and good luck in your trading endeavours. Your unwavering support is greatly appreciated.
If you wish to contribute, here are several ways you can assist us:
- Like our ideas
- Comment on our ideas
- Share our ideas
Team Setupsfx_🚀❤️
S&P 500 Braces for a Drop to $5,100–$5,177: Correction Coming?S&P 500 Braces for a Drop to $5,100–$5,177: Is the Correction Coming?
SP500 Reached the target of $5,680 - $5,800 and is going into correction along with Bitcoin 🤔.
Before:
After:
➖ The S&P 500 could fall to the 5100–5177 range due to the following fundamental factors:
FOMC Meeting on May 7: Expected rate hold and potentially hawkish rhetoric from Powell could amplify fears of rate hikes, hitting growth stocks.
➖ Trade War: Uncertainty in U.S.-China negotiations and risks of new tariffs threaten supply chains and corporate profits.
➖ Weak Economy: GDP contraction (-0.3% in Q1), recession fears, and weak PMI data fuel pessimism.
➖ Corporate Earnings: Disappointing guidance from key companies (e.g., Apple, Tesla) could trigger sell-offs.
➖ Sentiment on X: Bearish sentiment reflects market caution.
➖ Global Risks: Retaliatory tariffs and rising gold prices signal a flight from U.S. assets.
Assumption: If the Fed on May 7 emphasizes inflation risks and delays rate cuts, and tariff news remains negative, the S&P 500 could break support at 5500 and reach 5100–5177 within 1–2 weeks, especially amid technical selling and market panic.
XRP Price Showing Support at Key LevelsXRP Price Action Update (Friday)
Chart Overview: We're analyzing the 1-hour chart. The orange lines represent weekly opens over the past few months, which have acted as support levels.
Support and Resistance: The price has consistently found support at key levels, currently holding around the $2.29 range. It's also above the weekly close target of $2.35-$2.36, aiming for the next target around $2.44.
Trend Reversal Potential: If the price can hold above the $2.44 level and move toward $2.59, it would indicate a trend reversal on the weekly chart, moving us out of the current downtrend.
Watch for Retracement: Expect a possible price retracement due to the large value gap. If there's no immediate retracement, it might happen over the weekend before continuing upward.
Break of Structure: The daily chart has shown a break of structure, which is a positive sign. Keep an eye on the key order block for further confirmation.
potential buy idea NZDUSDA potential buying opportunity is emerging as the price breaks out of a descending trendline, fueled by a successful test of daily support and a bullish divergence on the 4-hour chart. The price has been creating higher highs, indicating a shift in momentum.
Key levels to watch:
1. Retest of the broken trendline for a potential long entry.
2. Break and retest of the 4-hour order block above, offering a secondary buying opportunity.
PS: This analysis is for educational purposes only and should not be considered financial advice. Always practice good risk management.
Should we go long on gold when it falls back?From a technical point of view, the daily line has been in negative trend, which is definitely weakening. Whether the market will continue in the future needs to be observed. If it is established, the lower side may be seen at 3260 and 3200, but if the daily line is positive on Friday, it can also turn strong at any time. After all, the current price is just near the middle track of the daily Bollinger, and both rise and fall are possible.
In the 4-hour cycle, we should pay attention to today's closing situation. The price is temporarily around 3300. If it continues to fall, the lower track of Bollinger will open, which may form a unilateral trend, rebound, and Bollinger will close, and it will rise strongly again. Therefore, it is not easy to say the specific rise and fall situation for the time being. It is recommended to observe more to see whether the Asian and European sessions break the new low of 3288, and the upper pressure is 3350 and 3370. In the morning, gold rose first and then fell, and it was quite fierce. It is recommended not to chase orders. Pay attention to the support of 3288 first. If it does not break, try to go long. If it breaks, it will go to the low point of 3260. It is expected that gold will have another wave of rising space on Friday.
CPOOL Bullish Reversal in Play? Key Levels To Watch!Yello, Paradisers! Could #CPOOL be setting up for a powerful breakout after months of pain? The price action is finally signaling that a major trend reversal might be brewing.
💎After an extended downtrend, CPOOL is now forming a bullish ascending triangle pattern—a classic structure that often leads to strong upside reversals. For the first time since January 19th, 2025, bulls have successfully pushed price above the EMA-50, indicating a shift in momentum.
💎#CPOOLUSDT is testing its neckline resistance between $0.1570 and $0.1720. This is the key breakout threshold—once breached with conviction, it’s expected to trigger a significant reversal wave and usher in a new bullish phase.
💎A confirmed breakout above $0.1720 would open the path toward the next major resistance between $0.230 and $0.250. This is the first profit-taking zone where short-term traders might look to offload positions. However, the structure suggests that this could just be the beginning.
💎If momentum continues, the full triangle breakout target lies higher—at $0.320 to $0.350. This area aligns with the 50% Fibonacci retracement level, making it a critical test zone for bulls. Traders should prepare for increased volatility and potential reversals in this zone, as it's likely to attract both sellers and momentum-driven buyers.
💎On the downside, primary support now rests at $0.1440, which is the current EMA-50 level. Below that, the ascending trendline support between $0.1275 and $0.1190 offers a firmer structural base and should be watched closely in the event of pullbacks.
Paradisers, strive for consistency, not quick profits. Treat the market as a businessman, not as a gambler.
MyCryptoParadise
iFeel the success🌴


